

So, Your Stocks Are Down.
So, Your Stocks Are Down.
Some history-based thoughts on when to not listen to the financial media, and when to sit tight.

Is This The Big One?
Over the last week stocks have done something weird, and seemingly unnatural—they went down.
The markets were roiled by volatility starting in Japan and then spreading outward to markets around the globe, prompting much hand-wringing and panic amongst the financial press. It was so bad that financial journalists couldn’t help but trot out their absolute favorite headline prompt “Market has worst day since XYZ” (in this case, the date of comparison was Black Monday).
Of course, it didn’t help that fresh in everyone’s minds was the fact that Warren Buffett—the man who never sells—had begun selling his Apple AAPL 0.00%↑ only days earlier (good timing, Warren).
The good folks are CNBC were on the scene, however, assuaging investor fears and generally trying to calm the markets. Oh, wait, no they weren’t.
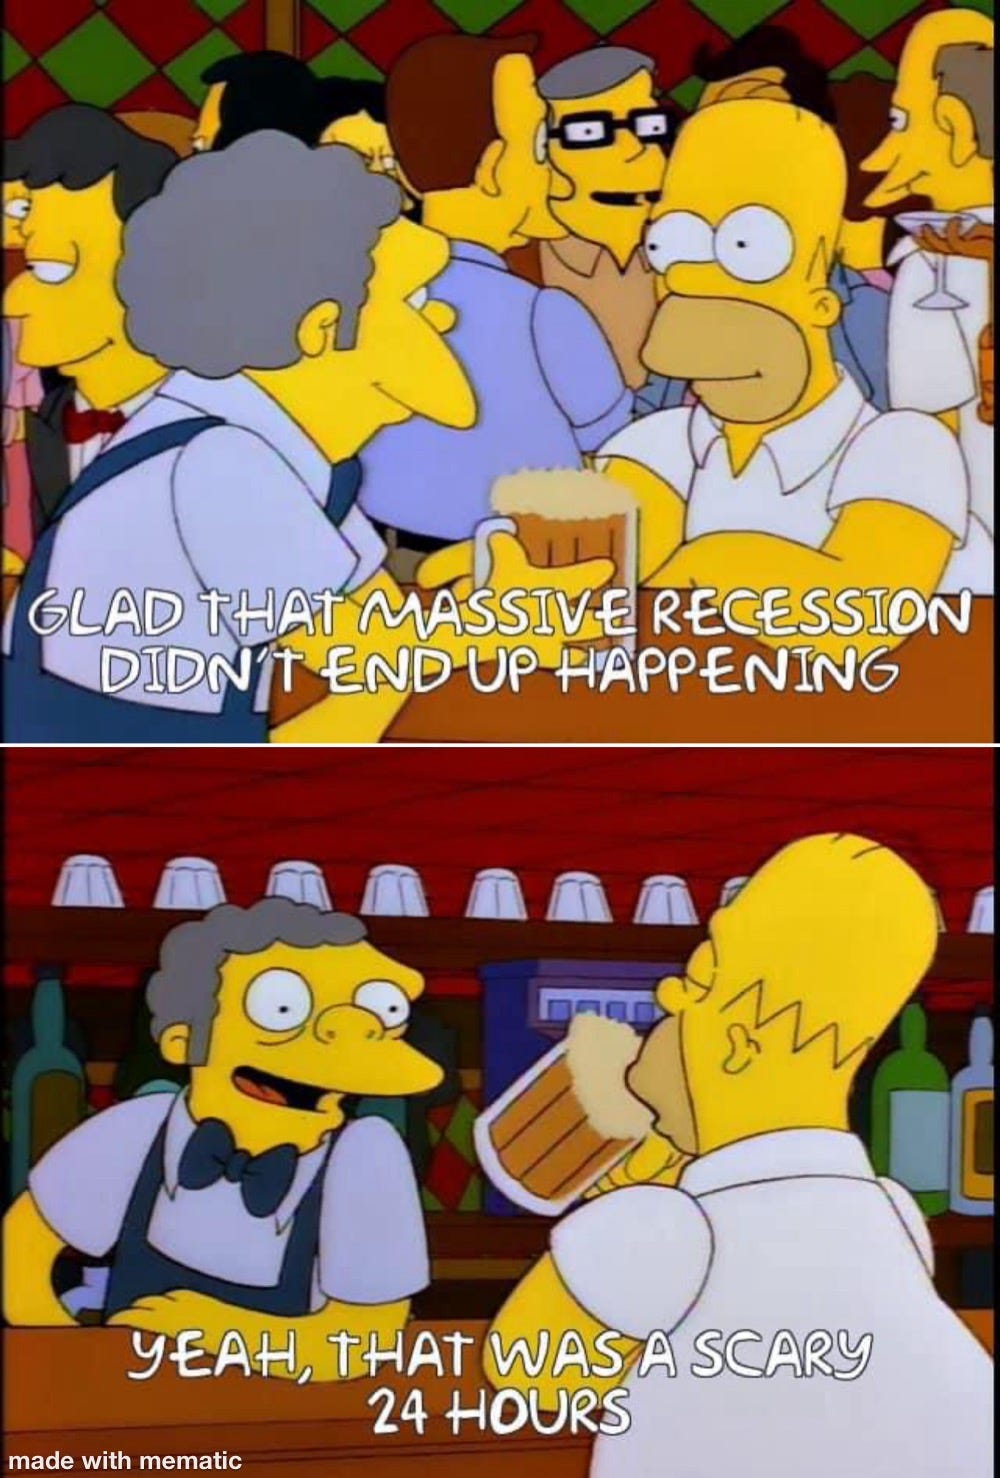
At any rate, I have to marvel at the ability of the financial media to turn investor’s focus from the long term to the right here and right NOW at every hint of a downturn in the market.
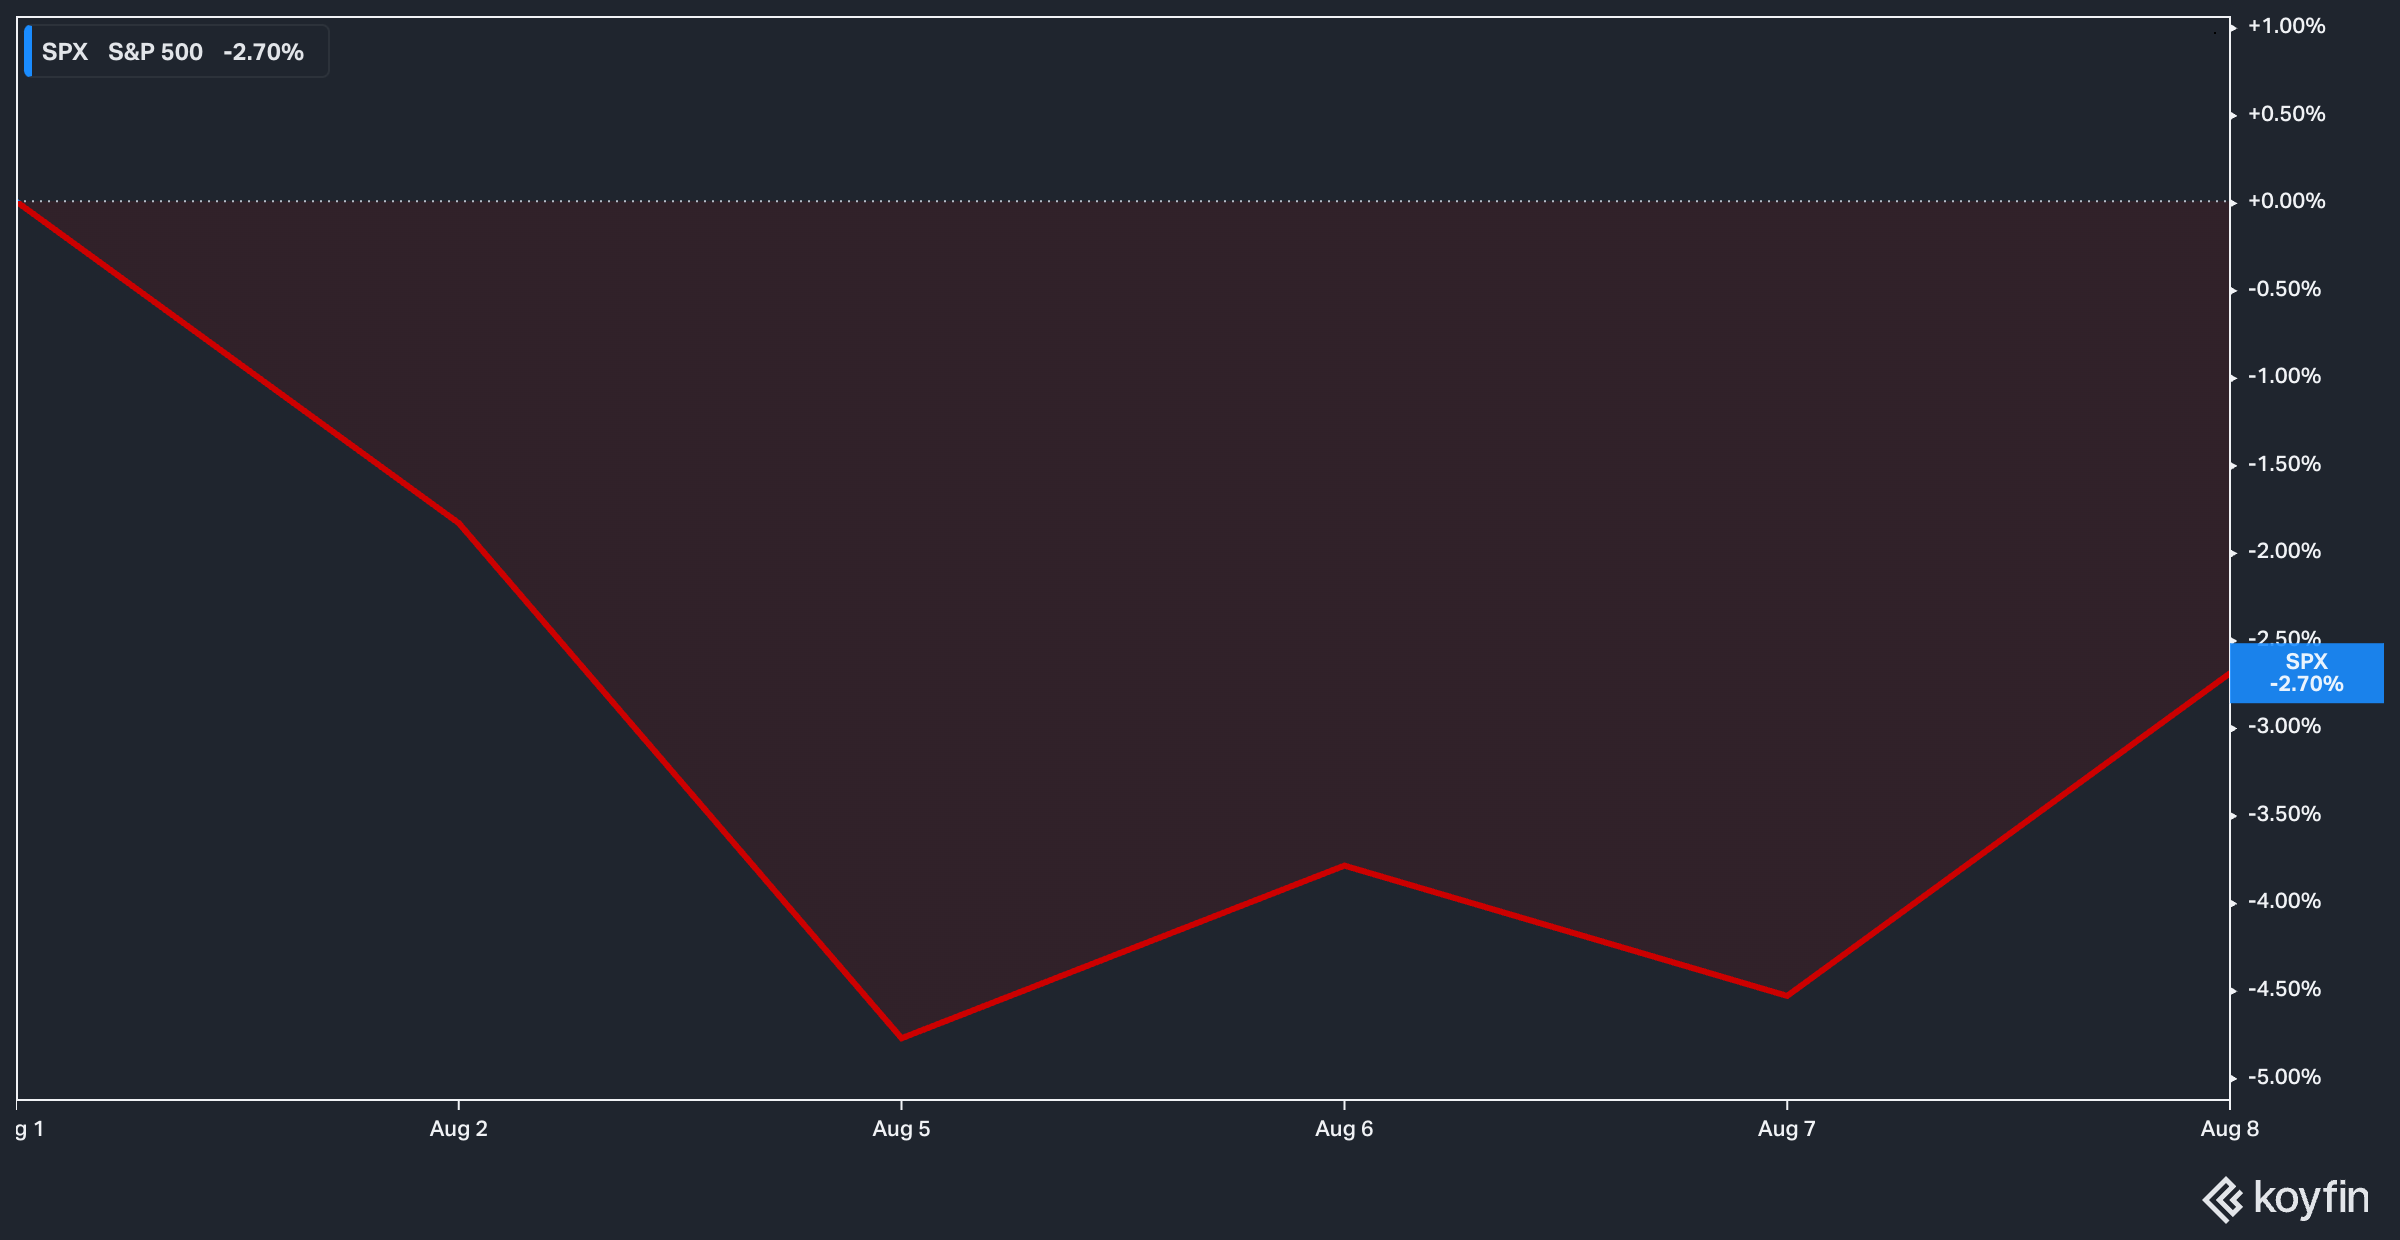
For context, SPY 0.00%↑ fell by close to 5% before rebounding 2-3%. Hardly the greatest rout in the history of financial markets.
Pulling back the lens, of course, paints a much more reassuring picture.
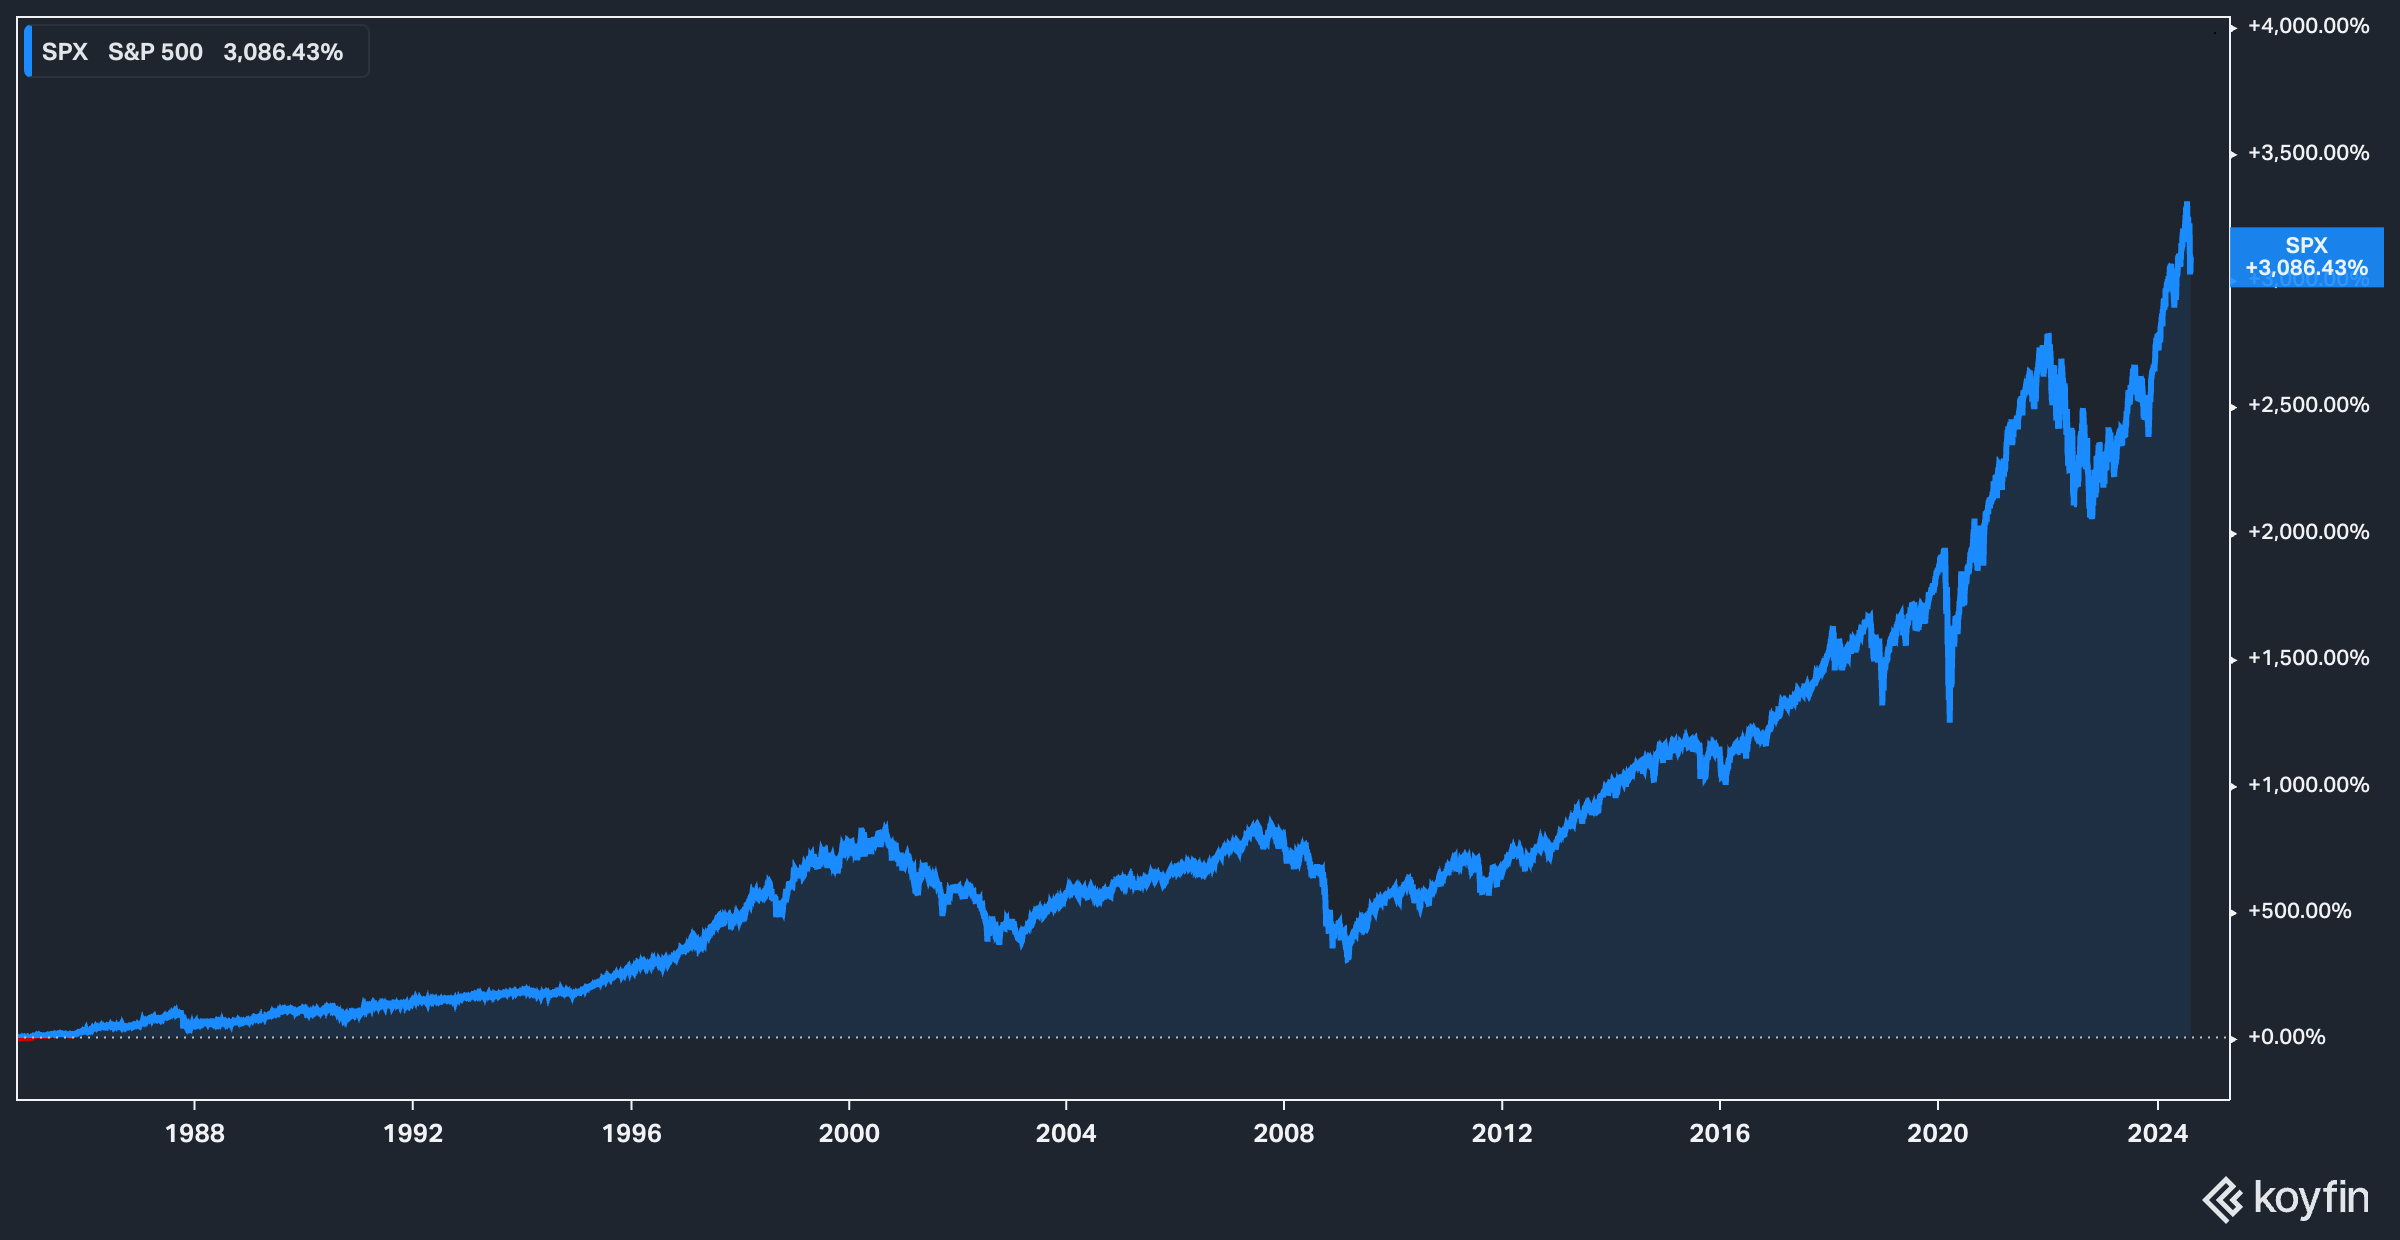
The above chart details SPX’s performance since September 1984—the month before Black Monday, for those paying attention. The biggest thing I think we can all glean from this chart is that bad days happen; hell, even some bad years happen, but the overall trend of the market is up and to the right over a very, very long sampling of time.
Of course, you wouldn’t know this—or, even if you did, it wouldn’t be top of mind—if you pay significant amounts of attention to the financial press.
Why Do They Do This?
Admittedly, this particular write-up is aimed at long-term investors who make relatively infrequent moves in their portfolios. More specifically, it is geared towards the rather large subset of long-term investors who pay a lot—a lot!—of attention to the financial media and various pundits, an industry that is unfortunately driven as much by clicks and eyeballs as anything else.
Bad financial news sells, and this is the reason why markets being down 2% in a day generates headlines like “IT’S OVER, FOLKS”.
It’s not just CNBC, either. There are plenty of hucksters out there selling their tales of perennial market doom. Nouriel Roubini, David Stockman, and Robert Kiyosaki all come to mind, each speaking to a very different audience with roughly the same tale to tell.
Indeed, for Kiyosaki, a man for whom I hold a special contempt, the market sell-off provided something of a vindication:
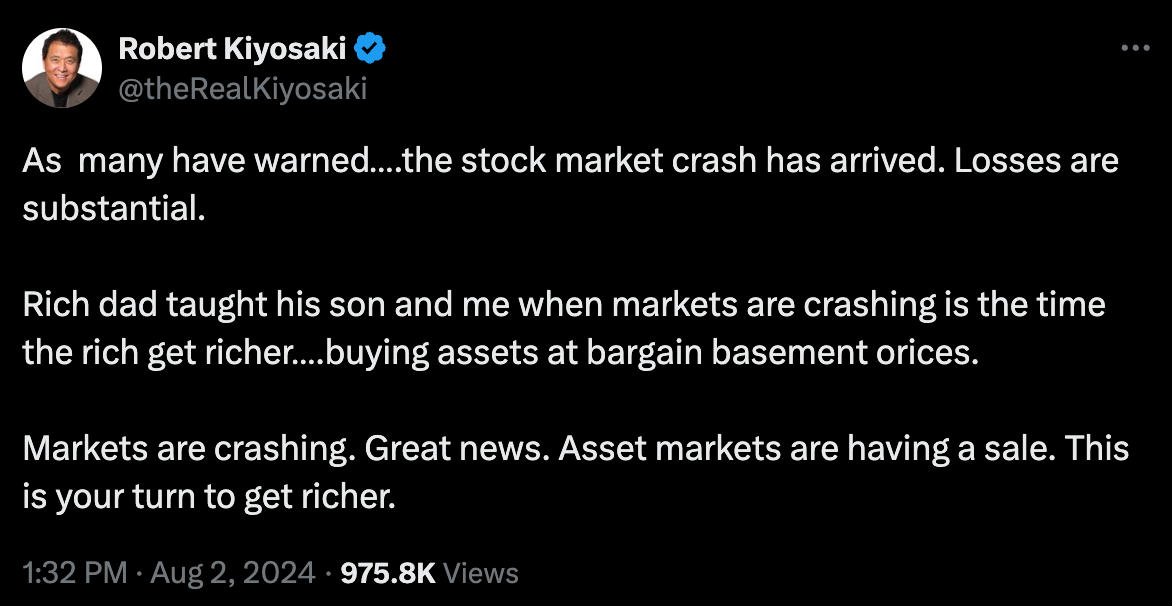
Is he wrong? Well, no. Sell-offs are, for investors with sitting cash, opportunities. A broken clock is right twice a day, though, and for those who are mercifully unfamiliar with Robert Kiyosaki’s BS, this is the flavor of post he makes during good times:

So, presumably, the man who tells his followers to not hold “US fake dollars” would not be terribly worried about the performance of a market inextricably tied to U.S. currency, but of course that’s not the case, since at the first sniff of a downturn he tweets that '“This is your turn to get richer.”
Anyway, I’ll get off my soapbox here about Robert Kiyosaki and his ilk, but not before sharing the most popular response to the first post, which sums up the argument pretty succinctly:
“Congrats after 15 years of calling for crash we got a 6% pull back from all time highs. Great call” — @gesmemaj1
Take The Long View
While Kiyosaki’s claims might seem particularly extreme, the sentiment is shared by virtually all of the perennial doomsayers. During good times, bad times are the bogeyman around every corner. They virtually never face any sort of consequence for being wrong the vast, vast majority of the time, and then when a bad day arrives they get to crow about how they’ve been right all along.
Of course, they may be right for the day, the week, maybe even the year, or, in exceptionally rare cases as the chart dating back to 1984 shows, several years, but over the long haul it has paid handsomely to remain bullish.
If you take nothing else from this article, then take this: the financial press has a short memory, but you don’t have to.
In other words, learn to sit tight. If you’re the kind of person who obsessively checks your 401K but doesn’t plan to touch it for 20 more years and who gets an emotional gut punch or euphoric high from each fluctuation of the market, then perhaps reflect on the fact that this behavior isn’t… well… helping you.
Turn off CNBC, shut down X, and enjoy sitting on your hands for the long haul.
Disclaimer: The content in this article is for informational, educational, and entertainment purposes only. This content is not investment advice, and individuals should conduct their own due diligence before investing. The author is not suggesting any investment recommendations—buy, sell, or otherwise. This article is not an investment research report but a reflection of the author’s opinion and own investment decisions based on the author’s best judgement at the time of writing and are subject to change without notice. The author does not provide personal or individualized investment advice or information tailored to the needs of any particular reader. Readers are responsible for their own investment decisions and should consult with their financial advisor before making any investment decisions. No statement or expression of opinion, or any other matter herein, directly or indirectly, is an offer or the solicitation of an offer to buy or sell the securities or financial instruments mentioned. Any projections, market outlooks, or estimates herein are forward-looking statements based upon certain assumptions that should not be construed as indicative of actual events that will occur. Any analysis presented is based on incomplete information, and is limited in scope and accuracy. The information and data in this article are obtained from sources believed to be reliable, but their accuracy and completeness are not guaranteed. The author expressly disclaims all liability for errors and omissions in the service and for the use or interpretation by others of information contained herein.
I look at ratios for investing.
You need to look back further than the last 40 years to see the big picture.
Gold dramatically outperforms the S&P 500 line in the early 1970s and 2000 to 2011.
Silver usually follows at outperforms gold.
Even though gold is at an all-time high, it's still relatively low to the S&P 500. Silver is at a historical low relative to the S&P 500.
Commodities as well.
I'm long the S&P 500, but I do it differently.
I buy gold, silver, and commodities when they're undervalued relative to the S&O 500, When they're expensive relative to the S&P 500, I sell them and buy the S&P 500.
After each cycle, I end up with several times more stocks for the same amount of money,
Great thoughts. There are so many permabears spitting doom and gloom and have been doing so for the last 1-3-5-10 years. These folks have already lost, and listening to them will lose you more money than it makes you.